Posts

Showing posts with the label ArcGIS

Formatting content in vbcsript adding new line

In ArcMap labelling, I need to parse the label into Customer Name and its account number with the account number appearing after new line: I used the code vbNewLine and it worked fine. [CUBAOmeters.CUSTOMER] & vbNewLine &  [CUBAOmeters.CAN] 

Creating a new field with attributes incrementing by 1

Image
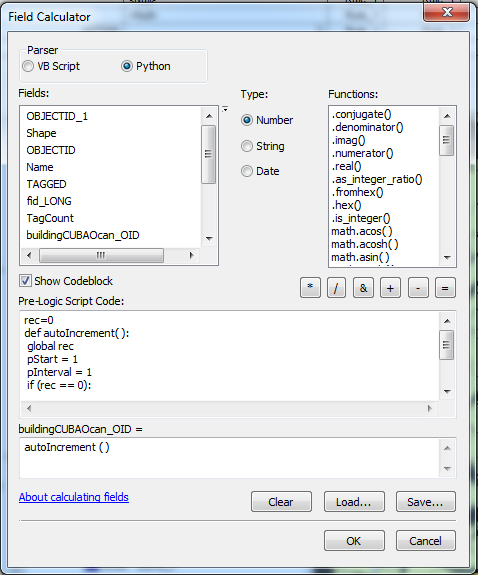
pre-logic script code: rec=0 def autoIncrement( ):  global rec  pStart = 1   pInterval = 1   if (rec == 0):    rec = pStart   else:    rec = rec + pInterval   return rec

Using wild card in Select by attribute for ArcGIS

Documenting: Using wildcard in Select by Attribute for ArcGIS: > Use % Sample: "LastName" LIKE '%REALTY%'

Removing string character from Field for FIELD CALCULATOR in ArcGIS

Image
Documenting: I want to remove String character "m" from the ELEVATION contour shapefile and convert String field to numerical Int or Double to get value of contour for geoprocessing. In ArcGIS 10.1, > create a new field containing length of string  : "LEN"       > calculate using Feild Calculator String Function len( )          > len ( ELEVATION) > Double field ELEV can be calculated      > Left( [ELEVATION], [len]-1 )

How to input LIDAR data in ArcGIS

Image
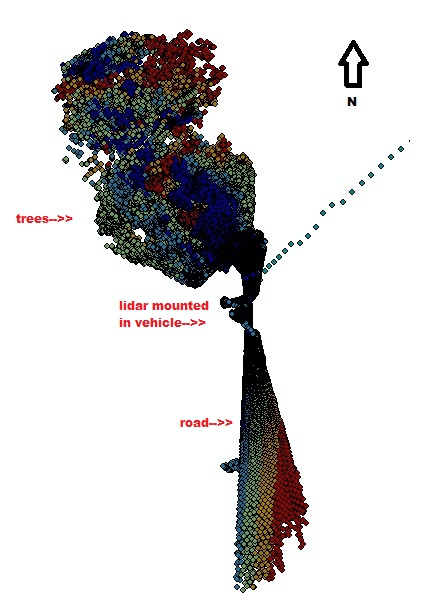
While I have been so problematic before how to resample my billions of points to have it visualized in 3D and further perform analysis over it, I found out that ArcGIS would be the best solution. The usual discretization is performed on my data, I scraped out all the noisy points by limiting my range to 5cm o 100m. Now I added another criterion, that is to remove all points below my LIDAR setup. That is to consider theta(horizontal FOV)<90 and theta >270 degrees. That in a way reduced my point cloud into almost 30% of the original. Memory-wise, it was a LUXURY already! Now for checking the irregularities in the observed point cloud, using the Point File Information Tool is by far the best solution. Using ArcGIS 10.0: 1. Go to 3D analayst tools>Conversion>From File> Point File Information. 2. You will be opt to browse lidar point cloud by File or by Folder. (I suggest that you browse by Folder if you've got more than 10 files.) 3. Now you will be opt for the f...

Some Matlab scripting and coordinate axes glitches on my codes

Image
I had some problems using my previous Matlab script on generating the converted latitude, longitude and height from the ECEF -X,Y,Z coordinates. for k = 1:5     matFilename = sprintf('%d.csv', k);     M = ecef2lla(textread(matFilename));     dlmwrite('sample.xyz',M, '-append'); end What happens right here is that it writes formatted values of the latitude, longitude and height formatted in three columsn but in 5 significant digits only hence creating duplicated coordinates which scraped up most of my values in the sample.xyz. It took me the whole long weekend to figure out how to improve the results, I know it's on the formatting only and  not on the predefined classes per se.  As I've always been familiar with the %3.2f tag for specifying the decimal places in a float, I have been trying all the way to fit in my argument but to no avail. I'm almost giving up on using the "dlmwrite" function and tried using the "fprintf...
How to prepare elevation range of SRTM in ArcMap for 3d visualization in ArcScene

If you have a DEM, you might want to view it in 3D. For me, I do geovisualization in ArcScene, VTP or for simple presentations I use Google Earth. DEM or digital elevation models contain the heights of our terrain. It has a commonly interchanged counterpart term known as DTM (digital terrain model). DEM differs from DTM in the sense that DEM is not the elevation from the ground per se. It is the height with the buildings and other cultural features. DTM on the other hand gives the height of the bare ground. For DEM, we can obtain freely available datasets such as SRTM and ASTER . SRTM resolution is 90m X 90m for the Philippines while ASTER is 30m x 30m. Though ASTER is of higher ground sampling distance than SRTM, researches show that SRTM still proves to be more accurate than ASTER.  So for the purpose of visualizing our terrain in 3d. What we would first want to do is to prepare the DEM (i.e. SRTM DEM ) for processing. If we fail to do this, we will be confronted with a very...

How to view shapefiles in Google Earth

Image
I have tried it in ArcGIS 9.3. In Arc Toolbox choose Conversion tools > To KML then choose the layer that you want to convert then choose scale as 1 if your data is currently in WGS84 projection. It will be saved as a zipped kml file (.kmz) because you chose to save a layer of your map document. Just double click the output kmz file and there you go. Here's a screenshot of my sample shapefile (Isabela, Philippines) as viewed from Google Earth. In one of my graduate course project, we have studied dengue and identify high, medium and low risk areas in  Quezon City, Philippines. We have also included the Google Earth upload of our output layers as part of our methodology. Here's a sample shot showing how the fields and attributes are preserved after exporting the shapefile to kmz. Dengue Hotspots in Quezon City, Philippines So there you go. I'll be posting too on how to work the other way around; from KML to SHP next time. Enjoy googling (^_^).

PYTHON CODE THAT ADDS A NEW FIELD TO A SHAPEFILE AND SPECIFIES ITS CONTENT

Arcpy class is new to ArcGIS 10.0. ArcPy is a site-package that builds on (and is a successor to) the successful arcgisscripting module. Its goal is to create the cornerstone for a useful and productive way to perform geographic data analysis, data conversion, data management, and map automation with Python. Here's a code that will add a new field to a shapefile and then specify the contents of the added field. In this case, all areas greater than 1000 square meters will be labelled "YES" meaning it is subdividable otherwise it will be "NOO". ********************************************************************************** import arcpy def cursor():     inFeatures = GetParameterAsText(0)     subdvdable = GetParameterAsText(1)     #inFeatures = "C:\\Users\\RS Lab\\Desktop\\222\\vector\\parcel_area.shp"     arcpy.AddField_management(inFeatures, subdvdable, "TEXT")     rows = arcpy.UpdateCursor(...

University of the Philippines Diliman Campus

Image
In our GIS class for Geomatics Engineering, we were asked to digitize a pan-sharpened Quickbird image of UP Diliman and specify the roads, buildings, and open spaces in the campus. Also this is my first time to import data from a handheld GPS into my GIS. Here's my output map: We we're also asked to georeference a "very old" aerial photo of UP Diliman campus. Here's the result:

merge tabfiles and shapefiles in one single shapefile

GeoMerge is a free geoprocessing tool which combines  ESRI shapefiles into one shapefile and even merges shapefiles and MapInfo tabfiles and ESRI shapefile into a single shapefile. Files with the same column definitions in the .dbf files will be concatenated in the new shapefile. Download GeoMerge.exe and see full details though this link.