Posts

Showing posts with the label GIS

Crowdsourcing GIS data

Geocommons

Removing string character from Field for FIELD CALCULATOR in ArcGIS

Image
Documenting: I want to remove String character "m" from the ELEVATION contour shapefile and convert String field to numerical Int or Double to get value of contour for geoprocessing. In ArcGIS 10.1, > create a new field containing length of string  : "LEN"       > calculate using Feild Calculator String Function len( )          > len ( ELEVATION) > Double field ELEV can be calculated      > Left( [ELEVATION], [len]-1 )

Free and Open Data Reliability : The case of Open Street Map road data vs "PAID" data sets

Image
This is the very typical example why the people in our country should free our data! Shown above is a map of my road data for a hydrologic model. Two unaligned road networks are visible from the image above. The red lines are my initial datasets which are actually "PAID" dataset from a government agency. When I did an overlay with a pan-sharpened satellite image, I got a large shift from the actual road network visible in the image itself. My initial notion is to georeference the image so that it would fit the readily available road data. However, when I tried overlaying the location of my mapped inlets, I noticed that the storm drain network which is aligned with the road coincides with that of my backdrop image. These inlet locations are in-situ observations gathered from a week of fieldwork hence there must've been a BIG problem with my road dataset. My next solution is to look for a free dataset. I have tried using Open Street Map data and alas! OSM data has a...

Off-the-fieldnotes: On fieldworks using Handheld receivers

Image
Last week was one tedious week, part of my primary data gathering is to map all the storm drains within my study area for my thesis. That was about 371 hectare area of land with a mix of residential, commercial and industrial land uses. I have used 2 types of Garmin Handheld receivers for this part, the Garmin Oregon 550 and the Garmin 76CSx for this storm drain inventory and mapping field work. I would say that both are pretty good in terms of accuracy for a handheld receivers with a purpose of mapping  features just for reconnaissance or coarse accuracy requirements. Here are my rants/raves two cents for fieldworks utilizing handheld GPS receivers i.e. GARMIN GPSmap 76CSx and Oregon 550. Do understand the primary purpose or objective of your data gathering and use the right tool for such purpose. -  You can't use a handheld GPS receiver to plot the corners of your lot and use it as an evidence for a land grabbing case. Have a clear understanding of the capabilities of t...

How to view shapefiles in Google Earth

Image
I have tried it in ArcGIS 9.3. In Arc Toolbox choose Conversion tools > To KML then choose the layer that you want to convert then choose scale as 1 if your data is currently in WGS84 projection. It will be saved as a zipped kml file (.kmz) because you chose to save a layer of your map document. Just double click the output kmz file and there you go. Here's a screenshot of my sample shapefile (Isabela, Philippines) as viewed from Google Earth. In one of my graduate course project, we have studied dengue and identify high, medium and low risk areas in  Quezon City, Philippines. We have also included the Google Earth upload of our output layers as part of our methodology. Here's a sample shot showing how the fields and attributes are preserved after exporting the shapefile to kmz. Dengue Hotspots in Quezon City, Philippines So there you go. I'll be posting too on how to work the other way around; from KML to SHP next time. Enjoy googling (^_^).

Got my first ever "new" 20-peso bill

Image
Philippine bills design have been revamped a few weeks ago. I got my first piece last 1.16.2011. Tantararaaaannn... Front design : New Philippine 20-peso Bill  President Manuel Quezon looks really fresh here. The Malacanan Palace is now on the front design as compared to the older 20-peso bill. It bears the signature of the current president at the time of this bill's production - Benigno S. Aquino III. Back design: New Philippine 20-peso bill At the back is a UNESCO World Heritage site - the Banawe Rice Terraces and the Palm Civet. Also on that day, I have been quite lucky to win a collector's item - a  "10-peso-commemorative-coin". 10-peso commemorative coin This is in commemoration of the People Power Revolution. The coin is made of pure nickel and 36-mm in diameter. 10-peso commemorative coin cover I just felt like being a numismatist on that day. Got two collector's item in a row. I'm happy and am looking forward to the other new Phil...

Creating Entity-relationship Diagrams (E-R Diagrams)

Image
Last semester for my introductory GIS class, part of a laboratory exercise is on creating E-R Diagrams which for me is a simple graph of the relationships between different objects within an interface. In programming, it is much like the UML (Unified Modeling Language) class diagrams that we are making before proceeding to the actual coding. E-R diagram  A data model, which is a high level description of the available data, is needed in storing relevant information in a database. In designing databases, there should be a conceptual and the physical phase. The creation of E-R (entity-relationship) diagrams belong to the conceptual phase. The E-R diagram serves as the blueprint before creating a database. There are things such as entity sets within an E-R Diagram 1. Entity – person, place, object, event, concept.  representation in the E-R diagram - table in the database shape in the E-R diagram -  RECTANGLE  2. Entity sets – collection of similar entities (sa...

Free online color matching tool for your maps

Image
 Maps do convey relevant information to a target audience.  Maps, apart from being informative, should be artistic too. Cartography is art. I mean you cannot just combine your violets with the greens or blues with it. A right combination of RGB or CMYK swatches will make it appear more pleasing and more eye-catching. And if you have 12 classes in a thematic map, you wouldn't want it to be randomly picked as if making some sort of lantern decoration for the Christmas season. Color coordination really is the name of the game. My husband who's into creative design is my one true critic when it comes to color combination. He would just peek into my final map for a project or laboratory exercise and then tell me to use this color or another color theme instead of my initial picks. He was such a relief when I am finishing my maps when he's at home. But when  he's not around, hard part comes. Anyways, I have stumbled upon this book last semester and found it really useful...

University of the Philippines Diliman Campus

Image
In our GIS class for Geomatics Engineering, we were asked to digitize a pan-sharpened Quickbird image of UP Diliman and specify the roads, buildings, and open spaces in the campus. Also this is my first time to import data from a handheld GPS into my GIS. Here's my output map: We we're also asked to georeference a "very old" aerial photo of UP Diliman campus. Here's the result:

merge tabfiles and shapefiles in one single shapefile

GeoMerge is a free geoprocessing tool which combines  ESRI shapefiles into one shapefile and even merges shapefiles and MapInfo tabfiles and ESRI shapefile into a single shapefile. Files with the same column definitions in the .dbf files will be concatenated in the new shapefile. Download GeoMerge.exe and see full details though this link.

Creating GIS data: Importing from text files and other sources

Image
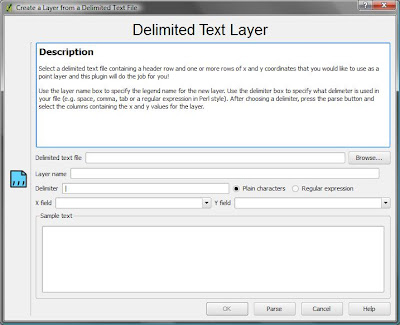
Oftentimes we have some data begging to be included in our GIS but the file format just couldn't fit in. For example we have found the data over the internet and it is not in .dbf  or .gdb format. But as long as it has a coordinate system data (i.e. latitude, longitude) there is still a way to include that in our GIS project. My latest GIS project is on including a delimited text layer in QGIS. QGIS supports the import of points only , while GRASS can accommodate all feature types in the GRASS vector model. My GIS Project What I have done is to map the location of all GPS campaign stations that our team has established since 1995. I have extracted the geographic location (latitude and longitude) information from the final coordinates file (FN*.crd) produced by Bernese 5.0 after post-processing the GPS data we have gathered on field. I have actually converted it from FILE format to .txt then imported the data in my GIS project. The Steps Firstly, I looked for a shapefile that covers...

GeoGREETINGS: How Geeks show they care.

Image
Out of the very busy day, I still have time to send my husband sweet regards. Just discovered the site and really had fun! What the program does is to let you enter a random phrase and the program automatically designates a structure found in the world map that would resemble the letters that you have typed. More interestingly, it has ♥ and smileys in it which makes it really cool. Here's my geoGreeting card and is animated through this link . Try showing how much you care too by clicking this link: http://www.geogreeting.com/main.html

Free Philippine Administrative Boundaries shapefile

Image
Free Administrative Boundary shapefile can be downloaded here . The coordinate reference system is latitude/longitude and the WGS84 datum. Other file formats such as ESRI geodatabase (.gdb), Google Earth (.kmz), and RData for RProject. Geospatial data from other countries are also available for download here. File Formats A "shapefile" consist of at least three actual files. This is a commonly used format that can be directly used in Arc-anything, DIVA-GIS , and many other programs. Unfortunately, non-latin characters are garbled. An "ESRI geodatabase" is an MS Access fole that can be opened in ArcGIS (an expensive but powerful program). One of its advantages, compared to a shapefile, is that it can store non-latin characters (e.g. Cyrillic and Chinese characters). A "Google Earth .kmz" file can be opened in Google Earth . A "RData" file can be used in R (with the sp package loaded) Some files have been compressed and grouped i...

CREATING A STAND-ALONE GIS APPLICATION

Image
Creating a Standalone GIS Application Sat, 02/07/2009 - 22:03 — Gary Sherman In this example we are going to begin to build a standalone GIS application using Python and the QGIS libraries. We'll start simple by creating an application to load and display a shapefile. In later posts we'll enhance the application to provide some map tools and other features. Requirements To build the application we need the following tools installed: QGIS 1.0 PyQt4 Qt 4.3 or higher and the development tools (Designer) Python 2.3 or better Testing the Environment Before getting started we need to test our development environment to make sure everything is in place. First we need to make sure Python can find the QGIS bindings. From a terminal or command shell on Linux or OS X: export PYTHONPATH=[path to]/share/qgis/python From a cmd shell on Windows: set PYTHONPATH=[path to QGIS]\python If you are using the OsGeo4W install of QGIS, all you need to do is start the OsGeo4w shell. No set...

BUFFERING USING QGIS

Image
The Volcano and the Buffer Mon, 04/27/2009 - 20:19 — Gary Sherman Here in Alaska we have over 130 volcanoes with more than 50 being active in about the last 250 years. Presently Mt. Redoubt is in an eruptive phase and has been since March 22. Ash from the volcano has fallen in a number of communities and areas throughout the state. A couple of weeks or so ago the reports from the Alaska Volcano Observatory indicated the ash was falling within 30 miles of the volcano. I decided to do a quick analysis to see what areas might be affected. This is an example of simple analysis with GIS. We just get the location of the volcano and create a 30 mile buffer and then visually determine the affected areas. To do this we need data for towns and the location of the volcano. We could use a volcano layer if we had one, but in this case I'm going to use a simple method to create a point shapefile from text data. The AVO website indicates that Mt. Redoubt is located at Latitude...

DESKTOP GIS: MAPPING THE PLANET WITH OPEN SOURCE TOOLS

PART 1 NOTES: common formats •Shapefiles(.shp) •GeoTIFForTIFFwithworldfiles(.tif,.tfw) •JPEGwithworldfiles(.jpg,.jpw) •GPSdata(.gpx) other vector formats •ArcInfoBinaryCoverage •ArcInfoInterchangeFile(.e00 •MapInfo(..tab,.mid,.mif) •SDTS,adatatransferstandardforbothvectorandrasterdata1 •TopologicallyIntegratedGeographicEncodingandReferencing (TIGER)data,usedanddistributedbytheU.S.CensusBureau •DigitalLineGraphics(DLG) other raster formats •ERMapperCompressedWavelets(.ecw) •ErdasImagine(.img) •DigitalElevationModels(.dem) •JPEG2000(.jp2,.j2k) •Multi-ResolutionSeamlessImageDatabase(MrSID)(.sid) •GTOPO30,aglobaldigitalelevationmodel(DEM)derivedfroma numberofrasterandvectorsources Note: use an OSGIS software that uses GDAL/OGR for accessing raster and vector data (GRASS and QGIS) data format deliverable over the web: Open Geospatial Consortium website http://www.opengeospatial.org WebMappingService(WMS), PostGIS -Creating a POSTGis-enabled database: WebFeaturesService(WFS), WebCoverageService...