Some Matlab scripting and coordinate axes glitches on my codes
I had some problems using my previous Matlab script on generating the converted latitude, longitude and height from the ECEF -X,Y,Z coordinates.
for k = 1:5
matFilename = sprintf('%d.csv', k);
M = ecef2lla(textread(matFilename));
dlmwrite('sample.xyz',M, '-append');
end
What happens right here is that it writes formatted values of the latitude, longitude and height formatted in three columsn but in 5 significant digits only hence creating duplicated coordinates which scraped up most of my values in the sample.xyz. It took me the whole long weekend to figure out how to improve the results, I know it's on the formatting only and not on the predefined classes per se.
As I've always been familiar with the %3.2f tag for specifying the decimal places in a float, I have been trying all the way to fit in my argument but to no avail. I'm almost giving up on using the "dlmwrite" function and tried using the "fprintf" which accepts the %X.Xf argument, however the matrices that used to be formatted in three columns are turning out to be printed in a single queue. So what now? I think I'd be having a hard time if I'd re-read and parse my final single-columned result to make it appear like three-columned file. So I tried going back to the 'dlmwite()' function. This forced me to read the entire dlmwrite code and Alas! I found out the 'precision' argument...ahhah! Now, my script is working perfectly just the way I want it.
for k = 1:500
matFilename = sprintf('%d.csv', k);
M = ecef2lla(textread(matFilename));
dlmwrite('sample.xyz',M, '-append', 'precision',10);
end
This simple Matlab code reads all the *.csv files within the folder where the matlab code was saved, applies the conversion from the earth-centered-earth-fixed X, Y,Z values through the ecef2lla function to get the latitude, longitude and height above the WGS-84 ellipsoid of the equivalent points then writes the result in the 'sample.xyz' text file. The converted coordinates for every new filename was appended to the matrix of coordinates. Now solving my previous formating problem, I specified the 'precision' argument then the value '10' to write a the formatted float values to 10 significant figures. Yey!
Now my next step is to plot my generated cloud of points in ArcGIS. And luckily, I have another problem to figure out, I did something wrong with the orientation of my velodyne LIDAR points with that of the ECEF coordinates.
Here's how it appeared in plan view using ArcMap. The orientation of the axis has been messed up.
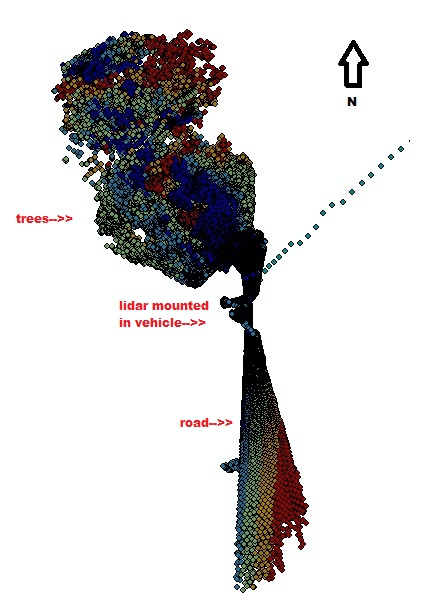
 Panning and rotating the views, the real orientation should have been this way.

Now I need to try all the possible permutations of the X,Y,Z... that would only be six so I am now up to my trial and error mode. Hopefully, I'd finish this and my next move is to port my Matlab ecef2lla function to python so I won't be cluttering all my processing steps. ;)
for k = 1:5
matFilename = sprintf('%d.csv', k);
M = ecef2lla(textread(matFilename));
dlmwrite('sample.xyz',M, '-append');
end
What happens right here is that it writes formatted values of the latitude, longitude and height formatted in three columsn but in 5 significant digits only hence creating duplicated coordinates which scraped up most of my values in the sample.xyz. It took me the whole long weekend to figure out how to improve the results, I know it's on the formatting only and not on the predefined classes per se.
As I've always been familiar with the %3.2f tag for specifying the decimal places in a float, I have been trying all the way to fit in my argument but to no avail. I'm almost giving up on using the "dlmwrite" function and tried using the "fprintf" which accepts the %X.Xf argument, however the matrices that used to be formatted in three columns are turning out to be printed in a single queue. So what now? I think I'd be having a hard time if I'd re-read and parse my final single-columned result to make it appear like three-columned file. So I tried going back to the 'dlmwite()' function. This forced me to read the entire dlmwrite code and Alas! I found out the 'precision' argument...ahhah! Now, my script is working perfectly just the way I want it.
for k = 1:500
matFilename = sprintf('%d.csv', k);
M = ecef2lla(textread(matFilename));
dlmwrite('sample.xyz',M, '-append', 'precision',10);
end
This simple Matlab code reads all the *.csv files within the folder where the matlab code was saved, applies the conversion from the earth-centered-earth-fixed X, Y,Z values through the ecef2lla function to get the latitude, longitude and height above the WGS-84 ellipsoid of the equivalent points then writes the result in the 'sample.xyz' text file. The converted coordinates for every new filename was appended to the matrix of coordinates. Now solving my previous formating problem, I specified the 'precision' argument then the value '10' to write a the formatted float values to 10 significant figures. Yey!
Now my next step is to plot my generated cloud of points in ArcGIS. And luckily, I have another problem to figure out, I did something wrong with the orientation of my velodyne LIDAR points with that of the ECEF coordinates.
Here's how it appeared in plan view using ArcMap. The orientation of the axis has been messed up.

And here's how it looks in perspective using ArcScene.


Now I need to try all the possible permutations of the X,Y,Z... that would only be six so I am now up to my trial and error mode. Hopefully, I'd finish this and my next move is to port my Matlab ecef2lla function to python so I won't be cluttering all my processing steps. ;)


Hi Mel,
ReplyDeleteKeep up the good work. If you need the HDL32E again please sms me at 09178993595.
I have the LiDar with me.
Jerome Lacap